Pragna
Securities
Wealth creation by trading financial instruments online
regulated by Government and funds protection by Law.
Gold is a commodity that is traded since ancient days. Many
businesses came and gone.
Humans needs are constantly updated. Hence no business
survives when time is considered. No wealth is created unless you hold Land
and Gold.
While Land cannot be traded too often with less money, Gold
can be traded with small money regularly.
Gold prices never are stagnant. It is determined by the
policies of govts.and the risks associated with other financial markets. It is
often used as Hedging tool by Govts to cover its risks and most of the
countries hold huge reserves of Gold.
How Gold can be traded online to make money ?
The idea of gold trading is to capture the volatility in
prices in a specified time frame or in percentage.
We have or provided many facilities in trading with time
based charts. It seems very few people win by trading time based charts and we
have also failed in many periods.
By our research in our ways of trading, it was found
relying on one particular setup was the cause.
We have come up with
Moving average based trend indicator (Hull MA super Trend) which is one
of the best indicator so far.
Here we cannot have a
specified format as prices of gold do not move in an uniform fashion, extreme
spikes has been witnessed upto 2.5% in an hour during the budget days of the
govt when govt imposed tax on on gold imports.
We developed an algorithm to find a particular parameter that
gave best results in past periods counted by no.of weeks. PSI set of
indicators.
Using a best parameters set up with the help of PSI
analytic, our trading did not give satisfactory results .Though we made moderate
money ,it was not consistent.
Consistency is an important factor for living and wealth
creation.
Internal trading analysis, it is understood now,it is not
worth trading with one set of
parameters.
It is now understood now one hour timeframe is the right
timeframe to tradewith.
It is now understood
now PSI -1 indicator is the right indicator.
It is now understood that we need to trade with datas
obtained from the PSI-GLMM scanner
for one hour timeframe .
Always we get 17
weeks data in MT4.
What we are going to do is:
1. calculate best parameters using GLMM scanner for 4 weeks.
2. calculate best parameters using GLMM scanner for 8 weeks.
3. calculate best parameters using GLMM scanner for 12
weeks.
4. calculate best parameters using GLMM scanner for 16
weeks.
Take the highest NPAT parameters for the above 4,8,12 and 16
weeks.
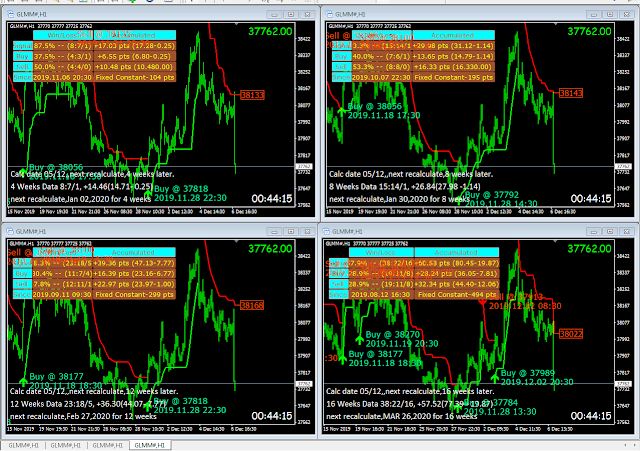
Load the parameters in four 60 min charts of MT4 GLMM#.
Use four brokers like
Zebu, TPO, Composite Edge and another one.
Put 30k, ( margin 20 k with spare money 10k ) in each broker.
Assign one 60 min charts to each broker with designated
weeks.
Trade buy sell signals with them.
Why we have to use 4 setups:
4 weeks parameter focus on short term while 16 weeks
parameter focus on longterm.
8 weeks and 12 weeks concentrate on midterm.
We do get four different parameters to trade.
instead of trading maximum lots in one setup, we diversify
and focus on different trends.
Short term setup -1 ( 4 weeks)
Midterm set up -2 (8 and 12 weeks)
Long term setup -1 ( 16 weeks)
The price volatility differ, vary every week and we focus on
16 weeks trend.
The aim is to make money consistently.
Next important thing is recalculation.
After completion of trading the first set up with 4 weeks
data, we recalculate again for 4 weeks.
After completion of trading the second set up with 8 weeks
data, we recalculate again for 8 weeks.
After completion of trading the third set up with 12 weeks
data, we recalculate again for 12 weeks.
After completion of trading the fourth set up with 16 weeks data, we recalculate
again for 16 weeks.
The parameter set files calculated on 05/12/19 are
4 weeks: 46,4,2.57 : 4 Weeks Data 8:7/1, +14.46(14.71- 0.25)
next recalculate: Jan 02,2020 for 4 Wks
8 weeks: 35.24.2.14:8 Weeks Data
15:14/1,+26.84(27.98-1.14)next recalculate,Jan 30,2020 for 8Wks
12 weeks : 33,51,2.33:12Weeks Data
23:18/5,+36.30(44.07-7.77)next recalcu,Feb 27,2020 for 12 wks
16weeks : 8,46,2.69:16Weeks Data
38:22/16,+57.52(77.39-19.87)next recalcu,Mar 26,2020 for16wks
The charts are loaded.
Buy sell condition indicator is used to
1.calculation date and when it is to be recalculated.
2.calculation datasets of designated weeks and P/L.
3. next recalculation date.
Indicators needed for this setup:
1.Gold mini scanner,
2.PSI-Hst
3.Buy sell conditions and
4.Time and Price.
It has been observed that the above 4 sets trading can yield
consistently 800 points per lot per month. This set trading beats the buy and
hold strategy by four times and generates return on investment over 6 times if traded over a year. i.e.,
1.10 lakhs investment may become 6.60 Lakhs Over the time out of the profits
generated lots can be added in the order of
8 W, 4 W, 16 W and 12 W.
In this way, every 6 months, one set (4 lots) can be added.
Trade patiently and be loyal to the system.
charts 06/12/19


No comments:
Post a Comment